| Year | Total students |
PP | FSM | PTFSM6CLA1A | LA | LA Total students |
PP | FSM |
|---|---|---|---|---|---|---|---|---|
| 2013 | 0 | – | – | – | Brent | 17821 | 38.4 | 23.8 |
| 2014 | 0 | – | – | – | Brent | 18002 | 36.9 | 18.4 |
| 2015 | 119 | 58.0 | 28.6 | – | Brent | 15124 | 32.9 | 13.9 |
| 2016 | 237 | 53.2 | 21.1 | – | Brent | 18503 | 33.7 | 13.2 |
| 2017 | 361 | 49.3 | 20.8 | – | Brent | 19626 | 31.0 | 12.4 |
| 2018 | 477 | 46.8 | 17.0 | – | Brent | 19425 | 30.3 | 11.4 |
| 2019 | 597 | 40.9 | 17.8 | 0.478 | Brent | 20313 | 29.0 | 13.0 |
| 2021 | 709 | 26.0 | 20.0 | – | Brent | 20981 | 21.3 | 17.5 |
| 2022 | 698 | 29.2 | 23.2 | 0.260 | Brent | 21190 | 26.1 | 20.0 |
| 2023 | 708 | 0.3 | 24.3 | 0.250 | Brent | 21365 | 0.3 | 21.5 |
Michaela School stats
This report is about Michaela Community School (URN:140862) in the Brent Local Authority. The report has been put together using DfE open datasets from 2013 to 2023. The aim of the report is to outline some of the underlying statistics for a school that has performed so well in the English progress 8 performance metric, and through comparisons with other similar providers, shed some light on the model that Michaela Community School uses to achieve such extraordinary results. As you will see, Michaela Community School is an outlier in many ways.
1 Limitations
- The below doesn’t double code Double GCSEs, instead, it currently treats them as a single GCSE entry.
- In the tables showing “Outstanding” Ofsted grades, the Outstanding grade might be from several years before. For example Energy Coast UTC appears in 2022 data as Outstanding, but not in 2023, as it was downgraded to “Good” (though Ofsted still does appear to approve of its curriculum offering).
- where I report a subject being offered below, this is where that subject was taken by 15 students or 10% or more of the KS4 exam entries in a school, this helps filter out subjects such as Portuguese that might be taken by Portuguese speaking students in a school as an additional exam and not actually be timetabled to be taught.
- The data this report is based off comes from the open DfE datasets, and this report is a trial run for testing these datasets. The DfE datasets are very messy and some mistakes might have slipped through.
- Errors are likely mine, please get in contact if you have any questions or corrections.
2 Student backgrounds
Michaela Community School serves a poorer community than the average school in the local authority, though the difference between Michaela’s students and the average in Brent has decreased substantially since the school began:
3 School exam comparison
Michaela has only ever entered students for GCSE exams (including GCSE Double Award),
| Subject offering at Michaela Community School | ||||
| percentage of students taking each exam | ||||
| subject | 2019 | 2021 | 2022 | 2023 |
|---|---|---|---|---|
| English Language GCSE | 99.13 | 98.29 | 100.00 | 100.00 |
| English Literature GCSE | 96.52 | 98.29 | 100.00 | 100.00 |
| Mathematics GCSE | 99.13 | 98.29 | 100.00 | 100.00 |
| Religious Studies GCSE | 85.22 | 98.29 | 100.00 | 100.00 |
| Science: Double Award GCSE | 96.52 | 98.29 | 100.00 | 100.00 |
| French GCSE | 82.61 | 76.07 | 74.17 | 76.86 |
| Geography GCSE | – | 23.93 | 23.33 | 44.63 |
| History GCSE | 85.22 | 52.14 | 50.83 | 33.06 |
| Art & Design (Photography) GCSE | – | – | 25.00 | 22.31 |
| Art & Design (Fine Art) GCSE | 7.83 | 21.37 | 25.00 | 19.83 |
| Arabic GCSE | 1.74 | 3.42 | 6.67 | 5.79 |
| Modern Greek GCSE | – | 0.85 | – | 0.83 |
| Polish GCSE | – | – | 0.83 | 0.83 |
| Chinese GCSE | – | – | – | 0.83 |
| Turkish GCSE | – | – | – | 0.83 |
| Art & Design GCSE | 0.87 | – | – | – |
| Biology GCSE | 2.61 | – | – | – |
| Chemistry GCSE | 2.61 | – | – | – |
| Italian GCSE | 0.87 | – | – | – |
| Physics GCSE | 2.61 | – | – | – |
| Spanish GCSE | 1.74 | – | 0.83 | – |
| Persian GCSE | – | 0.85 | 0.83 | – |
| Portuguese GCSE | – | – | 0.83 | – |
| Social Science: Citizenship GCSE | – | – | 25.83 | – |
3.1 GCSE subjects entered
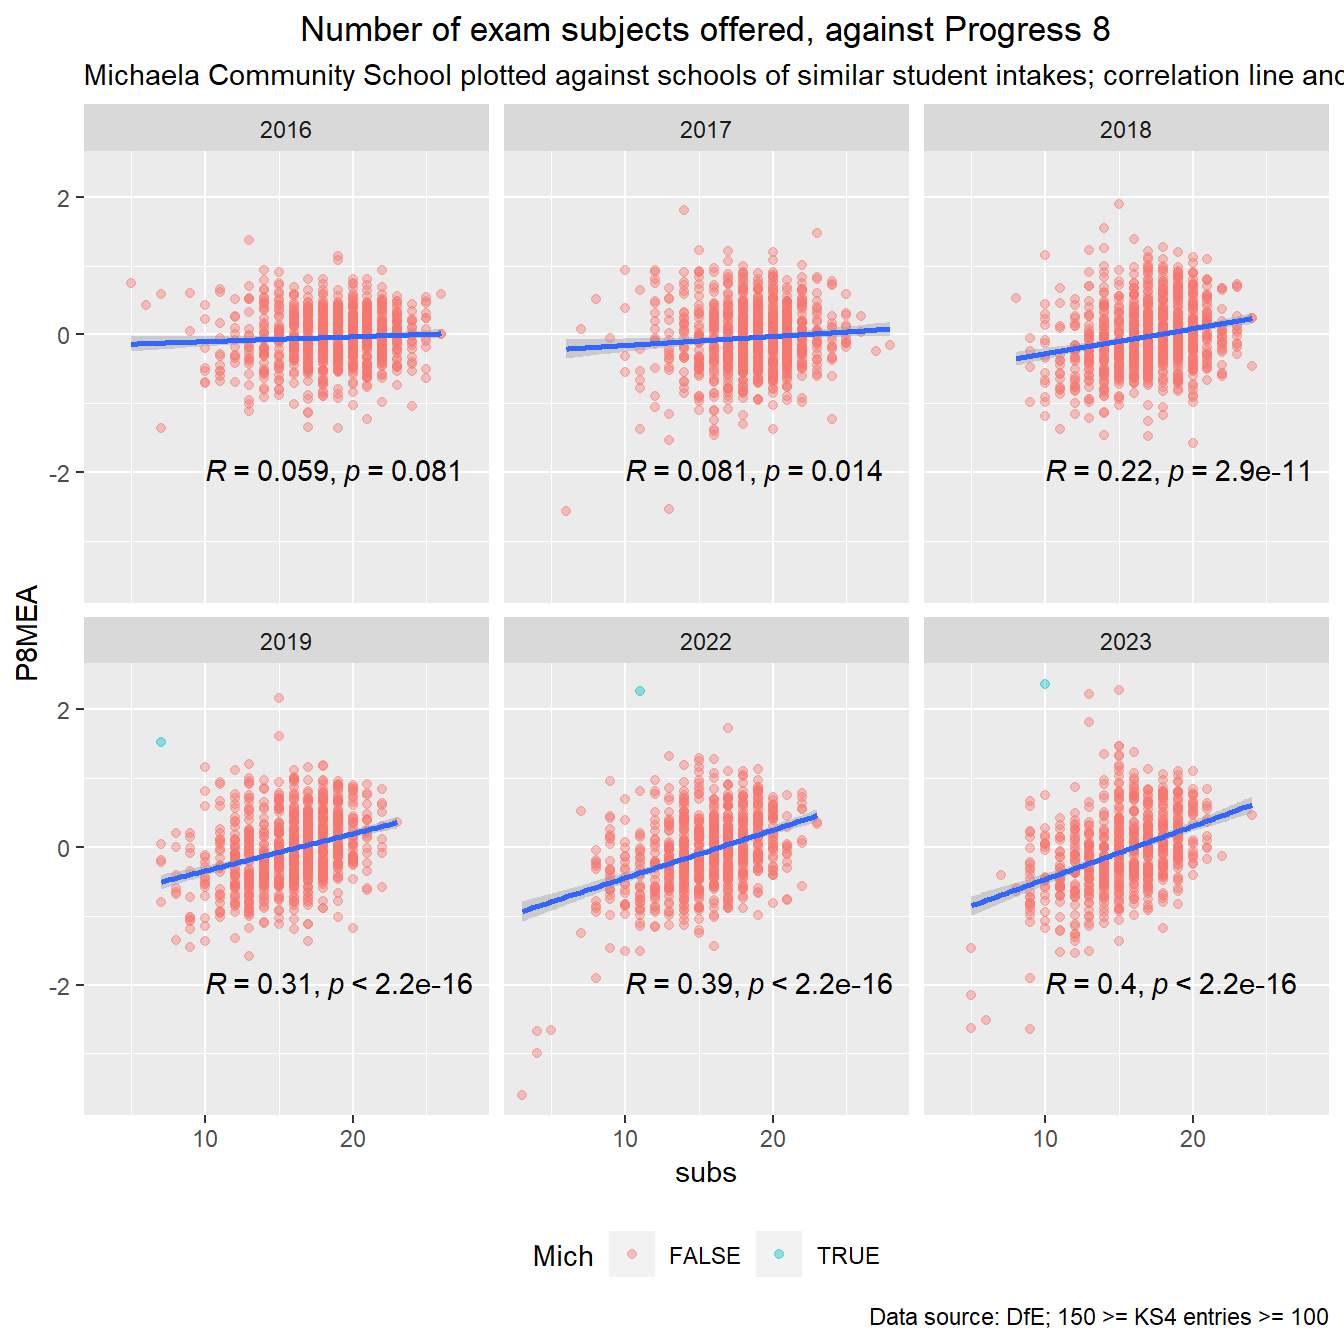
When looking at all non-special schools of a similar size to Michaela Community School (150 >= KS4 entries >= 100) across England, we have plotted the number of GCSE subjects offered (where >10% of KS4 students took an exam) against the Progress 8 score for each school. The correlation coefficients are included and they suggest that, on average for 2018-2023, the more exam subjects offered in these schools, the higher the P8 score. Michaela Community School appears to be an outlier.
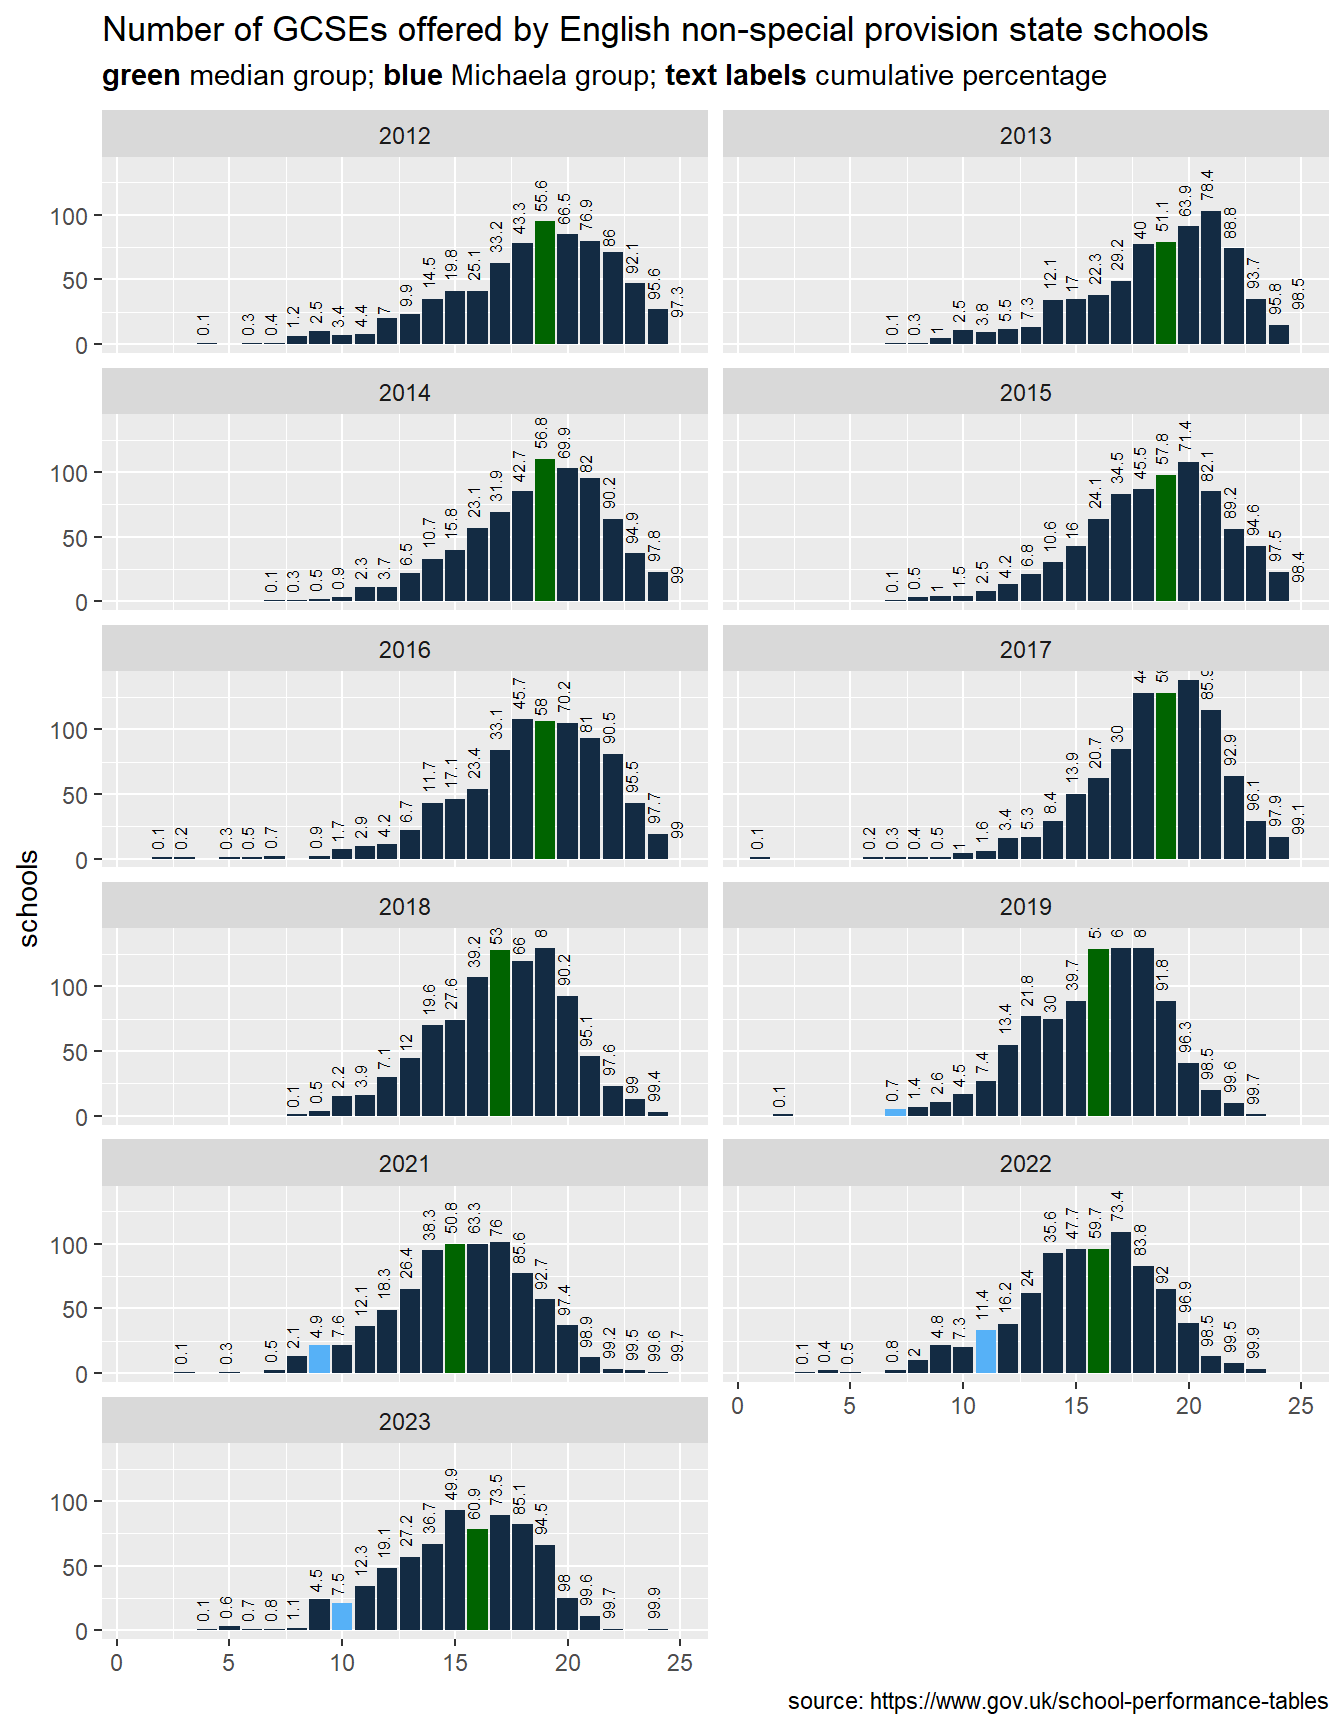
We can see the number of GCSEs entered for schools in 2023
Number of GCSEs offered in English non-special provision state schools
2023 data; >10% cohort taking them; Schools >= 100 and <=150 students
3.2 All subject entries
if you look at other subjects as well, e.g. vocational courses, Michaela Community School is more of an outlier, being within the lowest 1% of overall subjects for 2019-2023:
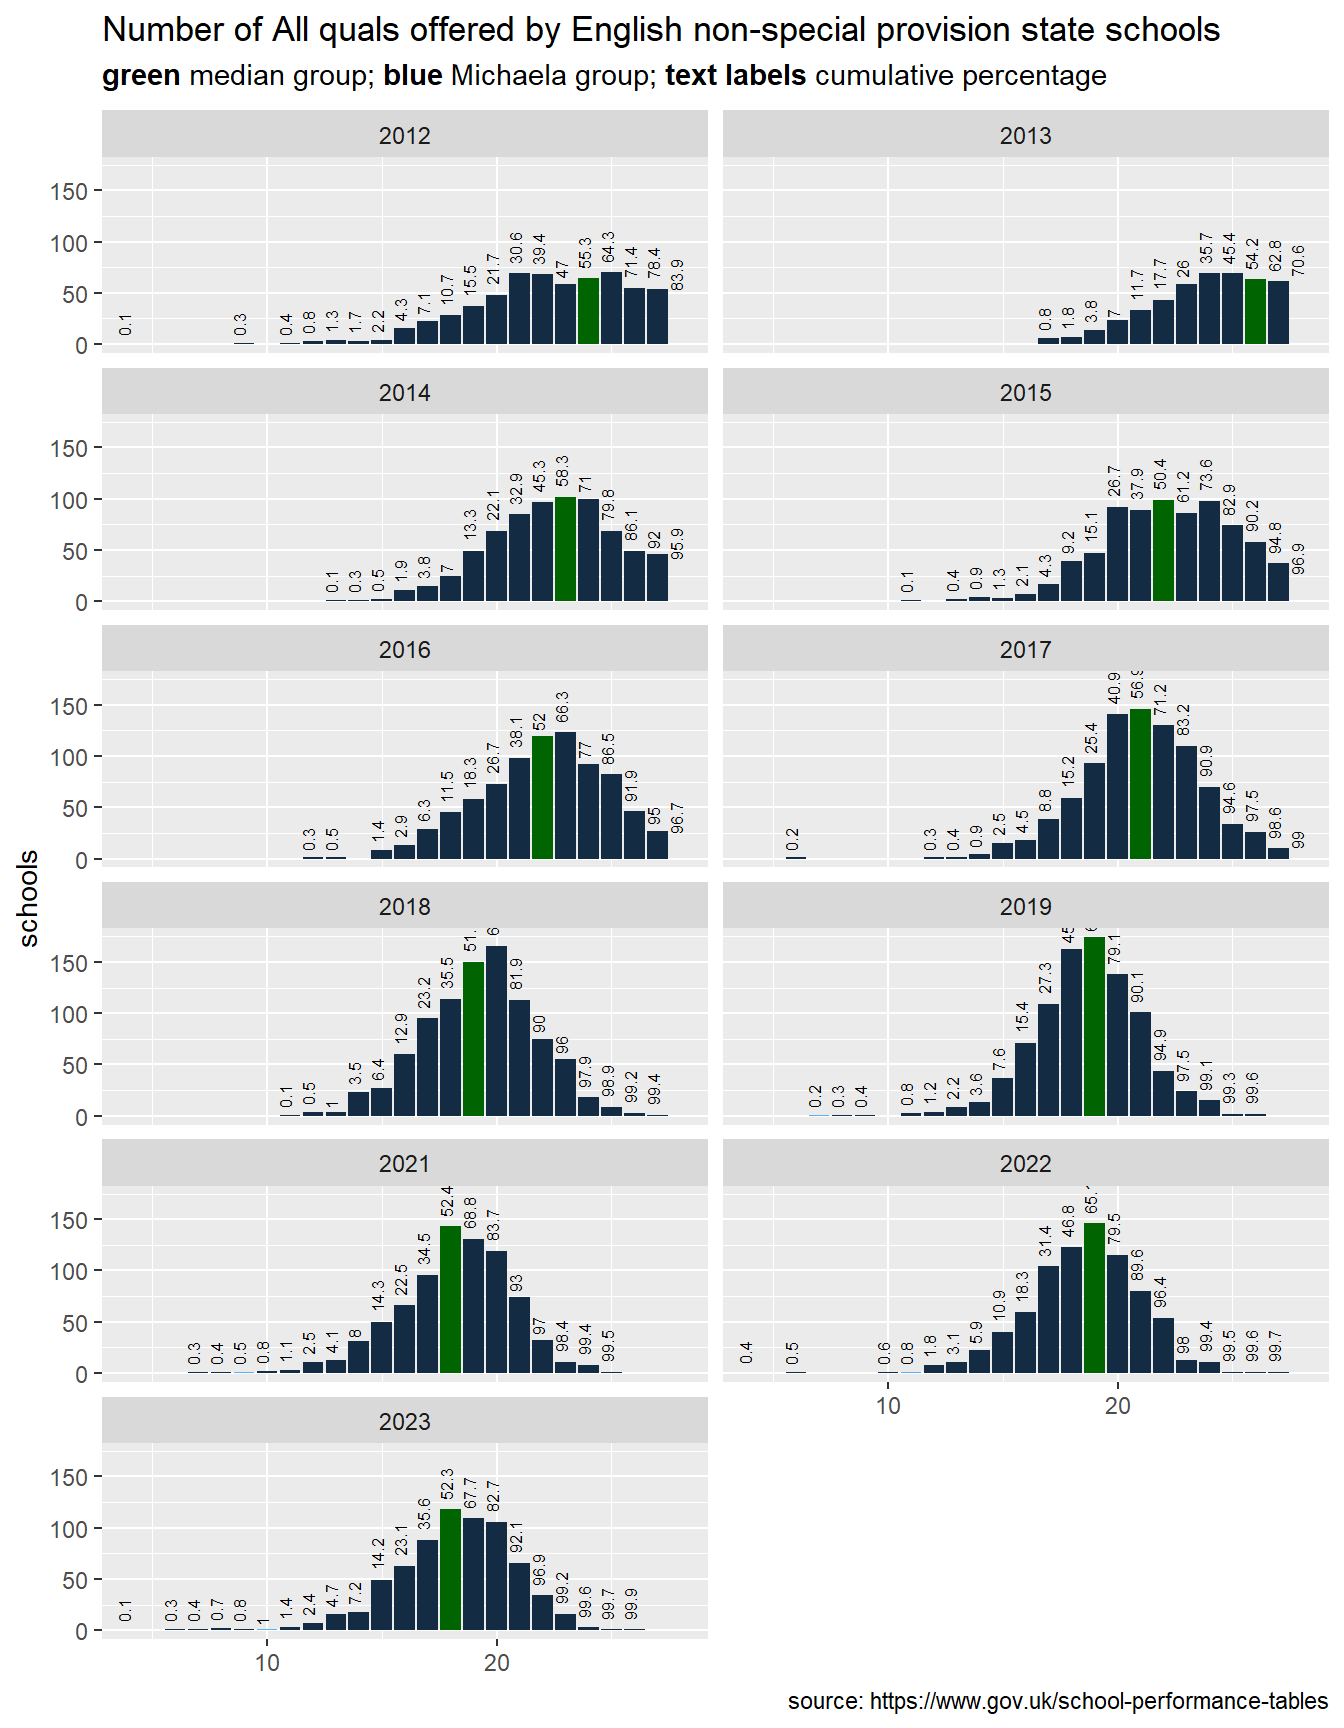
In 2023 they were 7th in the country for this criteria, among schools of a similar size:
Number of exam subjects offered in English non-special provision state schools
2023 data; >10% cohort taking them; Schools >= 100 and <=150 students
4 Schools of similar size and Oftsed rating
Michaela Community School’s 2023 Ofsted report states that “They plan a broad and exceptionally rich curriculum, which prepares pupils exceptionally well for the next steps in education”; the 2017 report says, similarly: “The curriculum ensures that pupils develop their knowledge and understanding across a broad and balanced range of subjects”.
4.1 All exam subjects
From the perspective of exam subjects, the exam subject offering at Michaela is far lower than nearly all other comparable schools, i.e. schools of similar size which currently hold an “Outstanding” Oftsed grade. There is only one exception in the data, with Energy Coast UTC, in 2022, having a smaller offering, likely to be made up of vocational qualifications.
This isn’t to say that Michaela Community School doesn’t offer a broad curriculum in other ways, for example through cross curricula teaching, extra curricula activities, non-examined and KS3 offerings. But it does highlight that the school’s approach is unorthodox.
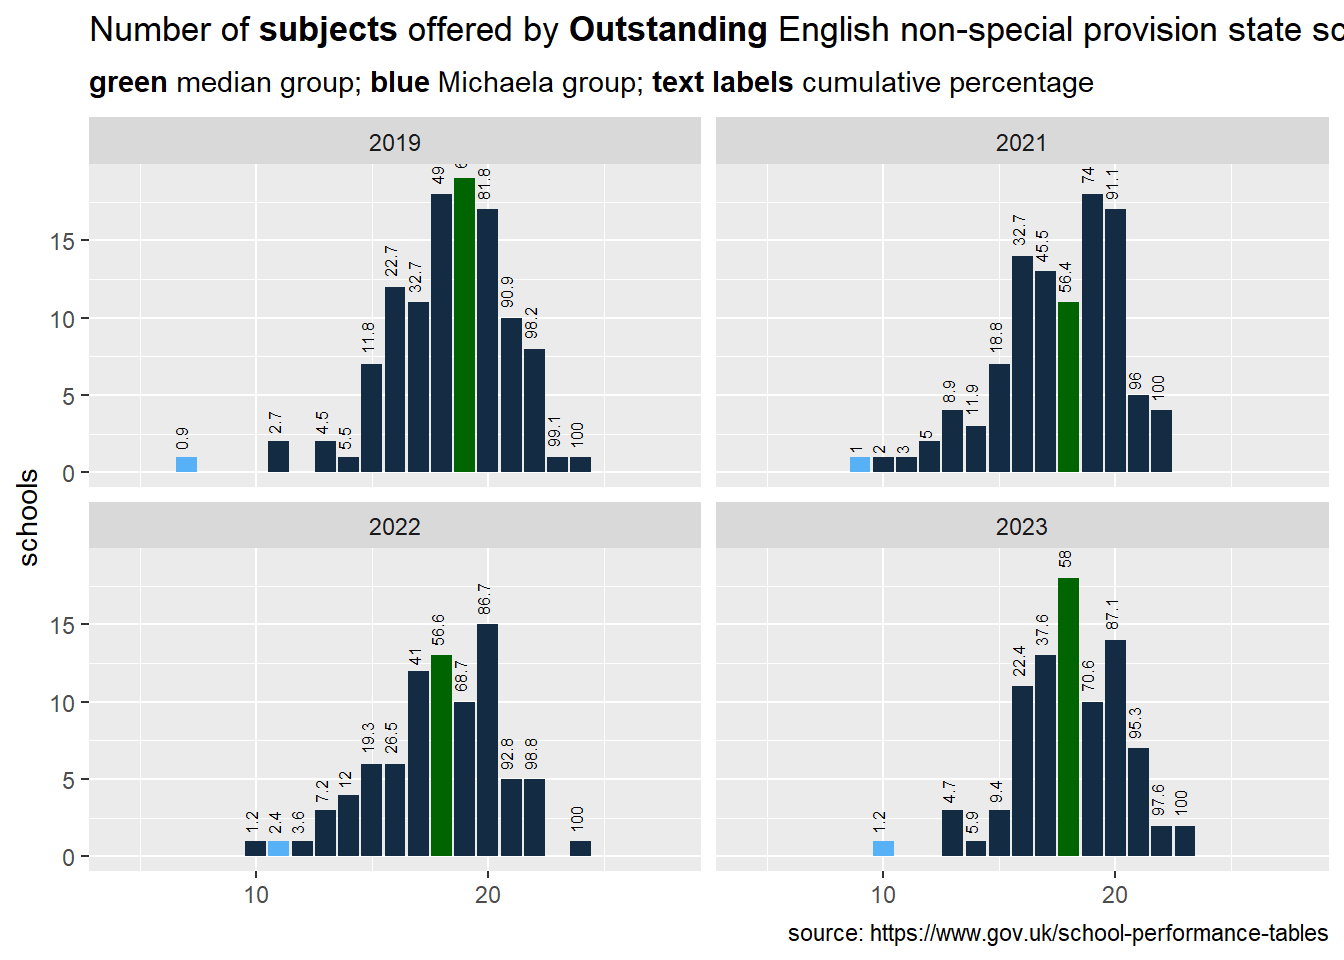
Number of subjects offered by Outstanding English non-special provision state schools
Data 2019-2023
4.2 GCSE exam subjects
We can perform the same analysis using GCSE only:
This places Michaela on the same number of GCSEs as two schools in 2019 (North Shore Academy; Ron Dearing UTC), higher than one school in 2021 (Energy Coast UTC) and higher than three schools in 2022 (Energy Coast UTC; De Lacy Academy; Ron Dearing UTC):
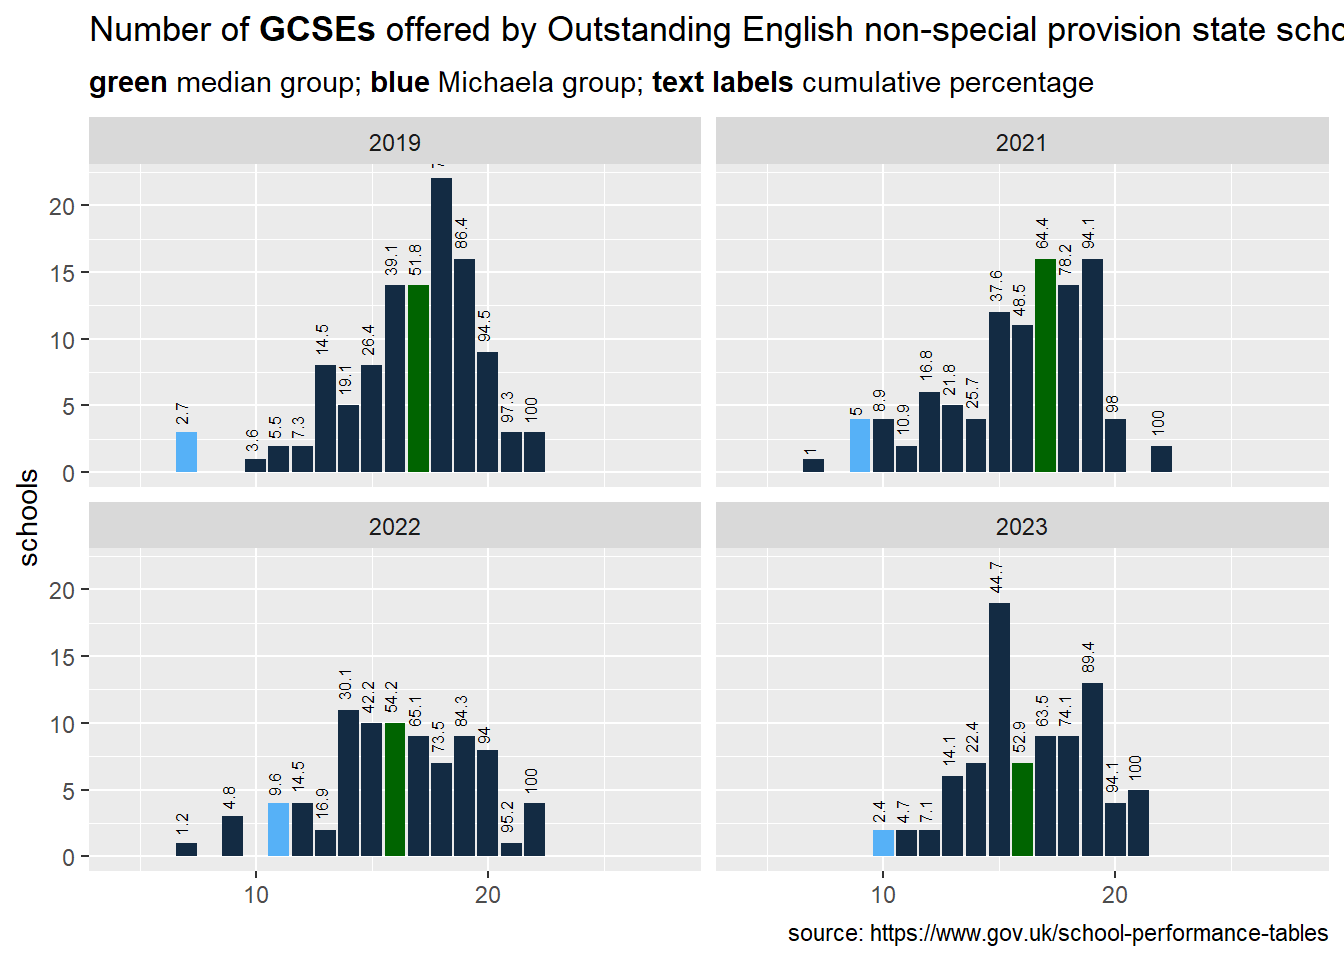
Number of GCSEs offered by Outstanding English non-special provision state schools
Data 2019-2023
5 Comparing subject offering to other schools
For direct subject comparison, we can see the entries for Energy Coast UTC (Outstanding Ofsted 2019, downgraded to Good in 2023) looking like this:
Subject offering at Energy Coast UTC
percentage of students taking each exam
De Lacy Academy (Outstanding Ofsted 2022), the year that it offered fewer GCSEs than Michaela you can see a significant number of other quals:
Subject offering at De Lacy Academy
percentage of students taking each exam
6 P8 summary tables
If we look at the top 100 highest performing P8 schools in 2023 we see that most offer triple science and Michaela retains the smallest number of GCSEs despite the fact that other schools are substantially smaller:
7 Models to predict P8 scores - standardised models
To predict the P8 score of a school we can look at total GCSEs offered total_GCSE; whether the school has a religious affiliation religion; total pupils TPUP in KS4 classes; Pupil premium % of KS4 population PTFSM6CLA1A; EAL % of KS4 population PTEALGRP2; and whether the school is offering triple science triple_sci. As these variables have vastly different distributions we will standardise the results by using their z-values this is done using the scale() command in R, allowing us to see what a standard deviation in each variable (except triple_sci and religion which are Boolean) will result in:
P8MEA ~ total_GCSE + religion + TPUP + PTFSM6CLA1A + PTEALGRP2 + triple_sci,
We can see that the two most powerful predictors are % of students on pupil premium (-0.47SD), number of GCSEs offered (+0.37SD), % of students who are EAL (+0.31SD), and a school being religiously affiliated (+0.19SD). The total pupil population TPUP is also significantly associated with P8 score, but the Beta value is small, at +0.07SD:
| Characteristic | Beta | 95% CI1 | p-value |
|---|---|---|---|
| total_GCSE | 0.37 | 0.32, 0.42 | <0.001 |
| religion | |||
| FALSE | — | — | |
| TRUE | 0.19 | 0.13, 0.24 | <0.001 |
| TPUP | -0.03 | -0.06, 0.01 | 0.14 |
| PTFSM6CLA1A | -0.47 | -0.50, -0.44 | <0.001 |
| PTEALGRP2 | 0.31 | 0.29, 0.33 | <0.001 |
| triple_sci | |||
| FALSE | — | — | |
| TRUE | 0.07 | 0.00, 0.15 | 0.039 |
| No. Obs. | 3,413 | ||
| R² | 0.634 | ||
| 1 CI = Confidence Interval | |||
Looking at mixed schools only, we can see that neither the numberof Girls GPUP or the number of Boys BPUP are statistically significant.
P8MEA ~ total_GCSE + religion + BPUP + GPUP + PTFSM6CLA1A + PTEALGRP2 + triple_sci
| Characteristic | Beta | 95% CI1 | p-value |
|---|---|---|---|
| total_GCSE | 0.35 | 0.31, 0.40 | <0.001 |
| religion | |||
| FALSE | — | — | |
| TRUE | 0.14 | 0.09, 0.20 | <0.001 |
| BPUP | -0.03 | -0.08, 0.03 | 0.4 |
| GPUP | 0.05 | 0.00, 0.11 | 0.065 |
| PTFSM6CLA1A | -0.42 | -0.46, -0.39 | <0.001 |
| PTEALGRP2 | 0.28 | 0.25, 0.30 | <0.001 |
| triple_sci | |||
| FALSE | — | — | |
| TRUE | 0.09 | 0.02, 0.17 | 0.011 |
| No. Obs. | 3,000 | ||
| R² | 0.598 | ||
| 1 CI = Confidence Interval | |||
8 Data sources
Data for this analysis comes from:
- https://www.compare-school-performance.service.gov.uk/download-data
- https://reports.ofsted.gov.uk